Homann/Doppelmayr’s map of the moon showing competing nomenclature (ca. 1742)
Mapping the Moonscape: A Crash Course in Early Lunar Cartography
by Joe McAlhany
Mapping the world is no easy task. The world as we know it today was charted in an ongoing, collaborative process spanning centuries—millennia, really—compiling wild speculation, secondhand accounts of distant lands, painstaking local surveys, ever-evolving boundaries, and countless adjustments. If mapping our own planet is that complicated, how could we ever hope to map a distant body like the Moon?
Until the Space Age, our only contact with the Moon was via sight, at first just naked-eye observation and then via telescopes beginning in the 17th century. Even the most casual stargazer knows that the Moon’s shape and appearance in the night sky is constantly shifting. The most obvious changes are the lunar phases, apparent to the ancients well before telescopes. What one can perceive on the Moon is always tied to the time it is observed. The features of the lunar face are only visible thanks to the shifting play of light and shadow caused by the angle of sunlight; in selenography, the measure of the reflectivity of the Moon’s surface is called albedo. The richest lunar detail is found along the terminator, the dividing line between the light and dark side of the Moon, but this line moves with the angle of the Sun. Making a consistent picture of the Moon even more challenging is libration, the rocking or wobbling effect created by the eccentricity of the Moon’s orbit and the tilting of the lunar axis relative to the Earth. Anybody hoping to make a Moon map would have to take all of these factors into consideration. Beyond having to interpret and account for these phenomena, they would then have to translate what they saw through the telescope lens into a drawing.
Given the daunting nature of the task, it is a miracle that we have any Moon maps at all! There are many lunar maps and images that have been produced since the invention of the telescope, however most of these are copies of previous maps rather than works based on original observations. As Francis J. Manasek notes in his A Treatise on Moon Maps, in the three-century stretch between Galileo’s first published telescopic observations and the emergence of reliable, detailed lunar photography, “Fewer than twenty maps based upon original telescope observation and covering the entire lunar hemisphere were published.” We do not have sufficient space here to write about all of the original maps, but we will look at some of the key early breakthroughs in lunar cartography from the 17th, 18th, and 19th centuries, before the invention of photography. For a more comprehensive approach to the subject, we highly recommend Manasek’s A Treatise on Moon Maps: Visual Studies on Paper, 1610-1910 and Ewen A. Whitaker’s Mapping and Naming the Moon: A History of Lunar Cartography and Nomenclature.
The First Moon Maps
William Gilbert’s Moon (image courtesy of the European Space Agency)
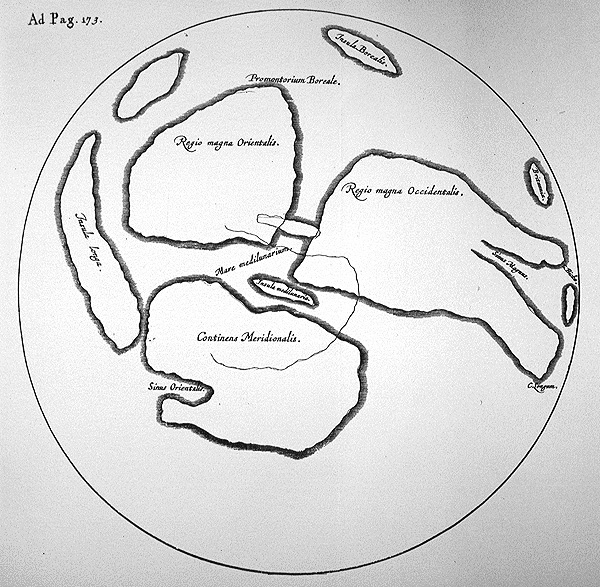
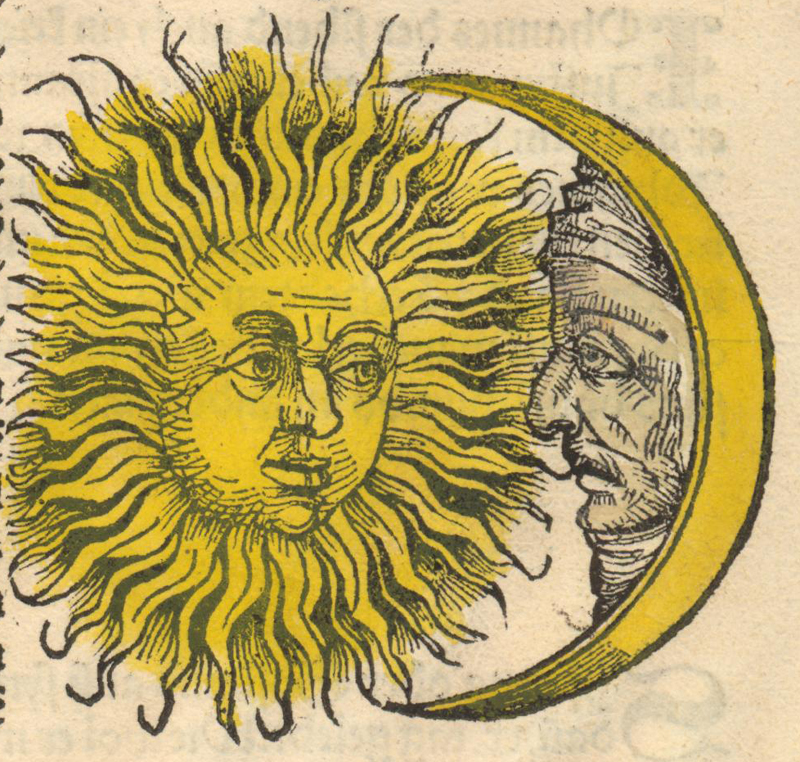
The earliest recorded map of the Moon is a pen-and-ink drawing by the English physician and natural philosopher William Gilbert. It was drawn circa 1600, prior to the invention of the telescope in 1608. Gilbert was disappointed by the lack of detailed Moon images from the past. He hoped that his map would serve as a record of the Moon as it appeared in his era, so that later generations could track any changes to its face over time. Of course there had been earlier illustrations of the Moon, but they were almost entirely symbolic in nature, like the crescent moon with a wizened face that appeared in Hartmann Schedel’s Nuremberg Chronicle in 1493. There is also half of a remaining sketch by Leonardo da Vinci that records the Moon’s dark markings, made circa 1513, but it is better classified as a scientific drawing than as a map.
Hartmann Schedel’s Moon (1493)
What distinguishes Gilbert’s map is that it seeks to locate and name the features of the Moon. Gilbert believed the shadows of the Moon were landforms, and labeled them accordingly with names like “Regio Magna Orientalis” and “Continens Meriodinalis.” He perceived the light areas as bodies of water, with names like “Mare Medilunaraum” and “Sinus Orientalis.” The map, which originally appeared in a manuscript copy of Gilbert’s De Mundo Nostro Sublunari Philosophia Nova (circa 1600), was not engraved and published until 1651. It is recognized as a milestone today, but because of its initial obscurity and primitive nature, its depiction of the Moon did not influence subsequent lunar cartography.
On August 5th, 1609, the English astronomer Thomas Hariot made the first known drawing of the Moon based on telescopic observation. (Hariot will be a familiar name for bibliophiles and early Virginia collectors—his account of Sir Walter Raleigh’s failed colony was reissued by Theodore de Bry as the first part of the Grands Voyages.) Like Gilbert’s map, Hariot’s various sketches of the Moon went unpublished at first, only appearing centuries later in 1965.
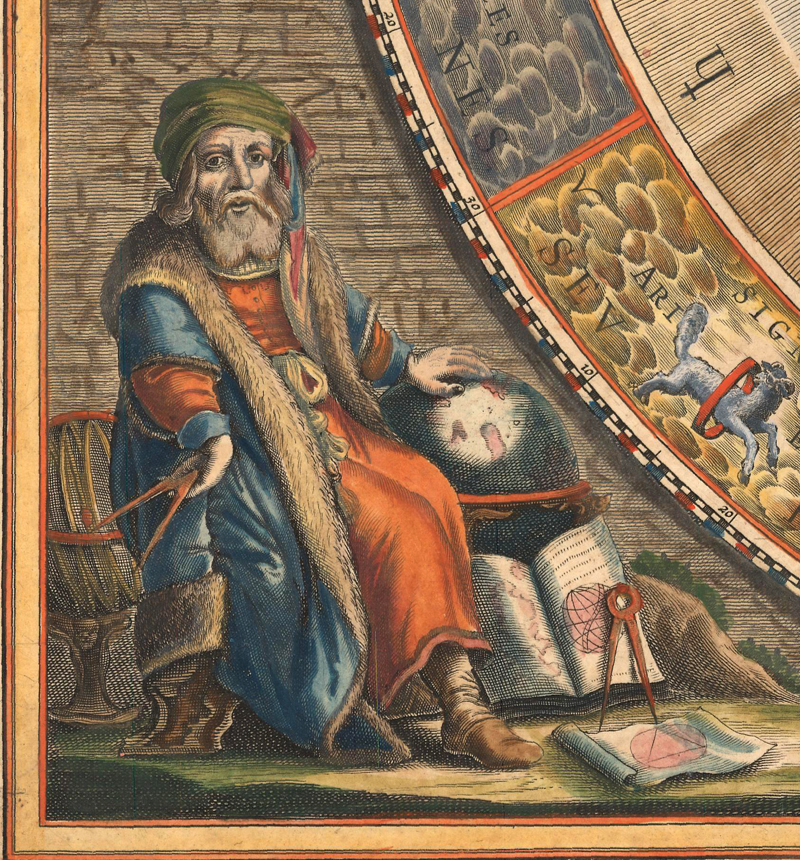
Galileo on Planisphaerium Copernicanum sive Systema Universi Totius Creati ex Hypothesi Copernicana in Plano Exhibitum (ca. 1661)
Far better known are the lunar renderings of Italian polymath Galileo Galilei, which were the earliest published telescopic images of the Moon. Galileo first drew the Moon on November 30, 1609, just a few months after Hariot’s drawing. The following year he included four copperplate engravings of the Moon in his Sidereus Nuncius (Starry Messenger). Galileo’s Moon was depicted with the north oriented to the top. This is worth noting because it is actually somewhat anomalous in the history of Moon maps. Galileo observed the Moon through a telescope with a concave lens, which presented a properly oriented image of the Moon. In the more advanced telescopes that followed, convex lenses were used, which enabled greater magnification. Telescopes with convex lenses produce an inverted image, which is why a majority of lunar maps made before the 20th century present an “upside-down” Moon, with the south oriented to the top.
Galileo made no attempt at naming the features of the lunar landscape, but he observed “great or ancient spots” on the Moon and theorized that the Moon, like the Earth, had a rugged, varied terrain, with great mountains and valleys. This was not necessarily a new idea—the ancient Greek philosopher Plutarch wrote of a lunar landscape with Earth-like features—but Galileo’s authoritative work shattered any lingering Aristotelian notions of the Moon as a perfect, uniform sphere. Sidereus Nuncius also convinced Johannes Kepler, the great German astronomer, that the dark areas on the Moon are maria (seas) and the lighter areas are terrae (land). Like Gilbert, Kepler had previously believed the opposite to be true. Maria and terrae are still terms used in selenography today. The maria are old lava flows that have filled impact basins, not bodies of water; the terrae (or highlands) consist of lighter anorthosite rock, dappled with craters.
The Name Game: Hevelius vs. Riccioli
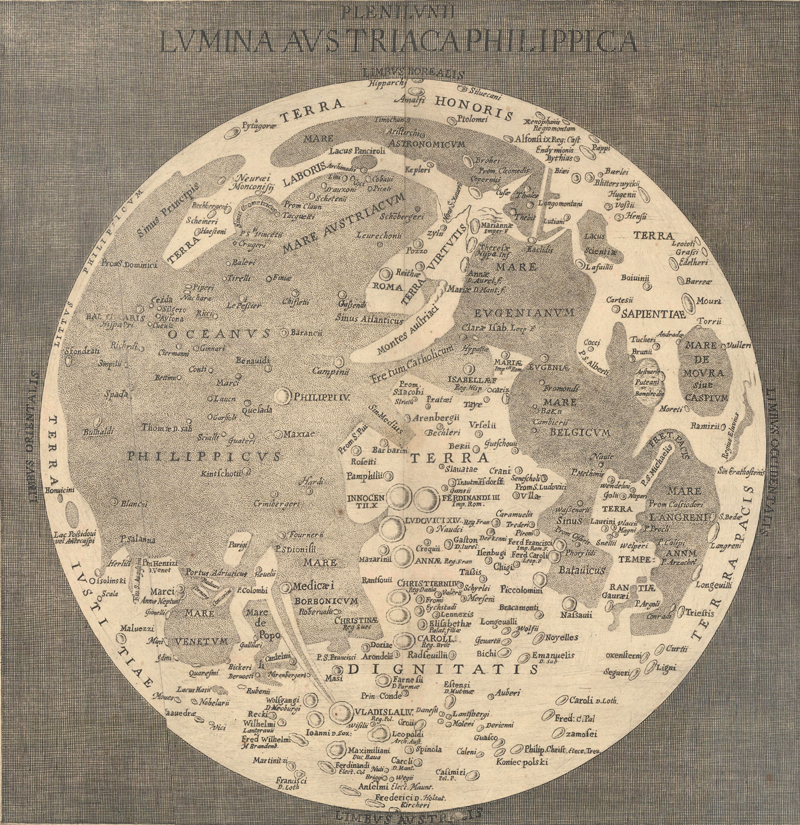
The pirated copy of Van Langren’s Plenilunii Lumina Austriaca Philippica (ca. 1650)
All of a sudden, the Moon had topography. And if it had topography, it could be mapped. But, as Gilbert recognized on his maiden effort in lunar cartography, maps need place names. The story of lunar nomenclature is complex and contentious, spanning centuries; the names of the Moon’s features were not formally standardized until the 1960s. The French mathematician and astronomer Pierre Gassendi was one of the first to try to devise a naming system for the Moon’s features, but his efforts, begun in 1628, were buried in his unpublished letters and journals. (His legacy is a lunar crater named after him.) Somewhat more successful was the contemporaneous project of Michiel van Langren (Langrenus), a member of a Flemish family of mapmakers who created a lunar map, Plenilunii Lumina Austriaca Philippica (1645), which was the first published map to attach proper names to specific locations on the Moon. Since Van Langren was serving as the Royal Cosmographer to King Felipe IV of Spain, his nomenclature leans heavily on royalty, the Habsburgs, notable Catholics, and other figures favored by the king. (Van Langren also could not resist naming one of the lunar maria after his own family.) Of the 325 names introduced by Van Langren, 68 are still used to this day; however, all but four were repurposed to apply to different features. Few original examples of his map survive today, but pirated editions occasionally appear on the collector’s market.
As Van Langren labored on his Moon map, he was increasingly concerned about the work of Johannes Hevelius, an astronomer located in the Polish-Lithuanian Commonwealth. He was right to be worried. Scion of a wealthy brewing family, Hevelius worked from his own state-of-the-art observatory in Gdańsk, using telescopes he built himself. In the autumn of 1643, he began compiling and drawing lunar observations that culminated in the publication of Selenographia, sive Lunae Descriptio in 1647. Technically, Selenographia is not the first lunar atlas—a year earlier, Francesco Fontana published his more rudimentary collection Novae Coelestium Terrestriumq Rerum Observationes—but its scope, scientific rigor, and remarkable engravings set a new standard in selenography. It remained the key work on the Moon for more than a century.
Johannes Zahn’s copy of Hevelius’s Map “Q” (ca. 1696)
Selenographia is most famous for its three double-page Moon maps: “P”, which captures the markings of the full Moon; “R”, which depicts topographical features visible during other phases, including the major maria and prominent craters; and “Q”, which borrows the visual conventions of terrestrial maps and introduces Hevelius’s system of nomenclature. Hevelius saw similarities between certain topographical features on the Moon and on the Earth so he projected terrestrial names onto the Moon. For instance, in the vast “Mare Mediterraneum,” Hevelius identifies a landform called “Sicilia” with a crater at its center called “Mt. Aetna.”
Riccioli/Grimaldi’s Pro Nomenclatura, et Libratione Lunari… (1651)
What better way to understand a distant celestial body than by comparing its features to recognizable sites on the Earth? There is a logic to Hevelius’s naming scheme, but his lengthy Latinized place names were eventually phased out by the competing nomenclature of the Italian Jesuit astronomer Giovanni Battista Riccioli. In 1651, Riccioli published Almagestum Novum, a two-volume scientific encyclopedia that included two large lunar maps made by Francesco Maria Grimaldi, based on the observations of Van Langren and Hevelius. On the second map, Grimaldi introduces Riccioli’s nomenclature. For the maria and landmasses, Riccioli favored names connected to weather conditions, like “Mare Tranquilitatis” (Sea of Tranquility) and “Mare Imbrium” (Sea of Showers or Rains). Riccioli followed Van Langren in deciding to name other features after famous people, and even appropriated 63 of Van Langren’s names. However, Riccioli’s system skirted potential political controversy by using only the names of deceased philosophers and scholars with a connection to astronomy. So Hevelius’s “Mt. Aetna” became “Copernicus” in Riccioli’s nomenclature; among the other names used by Riccioli were Tycho, Plato, Aristoteles, and Hipparchus.
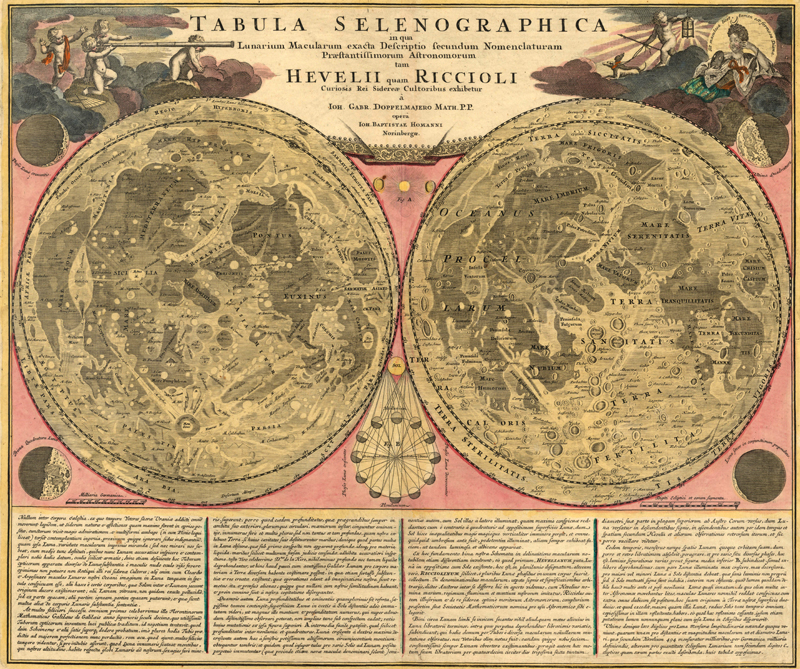
Homann/Doppelmayr’s Tabula Selenographica in qua Lunarium Macularum Exacta Descriptio Secundum Nomenclaturam Praestantissimorum Astronomorum tam Hevelii quam Riccioli… (ca. 1742)
For the next 150 years, selenography was split between Hevelius and Riccioli’s nomenclatures. Rather than picking sides, many publications included Moon maps based on both Hevelius and Riccioli. The most notable example of this is Johann Baptist Homann and Johann Gabriel Doppelmayr’s Tabula Selenographica in qua Lunarium Macularum Exacta Descriptio Secundum Nomenclaturam Praestantissimorum Astronomorum tam Hevelii quam Riccioli…, which was first engraved for Homann's Neuer Atlas in 1707, before appearing in Atlas Coelestis (1742) and its revised edition Atlas Novus Coelestis (1748). This popular double-hemisphere map was the perfect illustration of the competing systems, with the nomenclature of Hevelius and Riccioli depicted side-by-side on an unusually decorative sheet.
Ultimately, Riccioli’s system of naming features after scientists and other intellectual heroes won out over Hevelius’s Earth-centric names. Whitaker identifies the deciding factor as the use of Riccioli’s nomenclature on the lunar drawings in Johann Hieronymus Schröter’s major work Selenotopographische Fragmente (first volume published in 1791, second volume published in 1802). The unprecedented level of detail in Selenotopographische Fragmente signaled the beginning of a new epoch in selenography. Schröter acknowledged his debt to Hevelius’s Selenographia, up to that point the classic work of selenography, but he relegated Hevelius’s nomenclature to the text and index. His real preference was revealed in the map images. Schröter’s choice of nomenclature ensured that Riccioli’s system would be the standard going forward. In 1969, Neil Armstrong would make his “giant leap for mankind” on Riccioli’s Mare Tranquillitatis, not Hevelius’s Pontus Euxinus. (We will discuss Selenotopographische Fragmente in more detail later on.)
More Key Moon Maps of the 17th Century
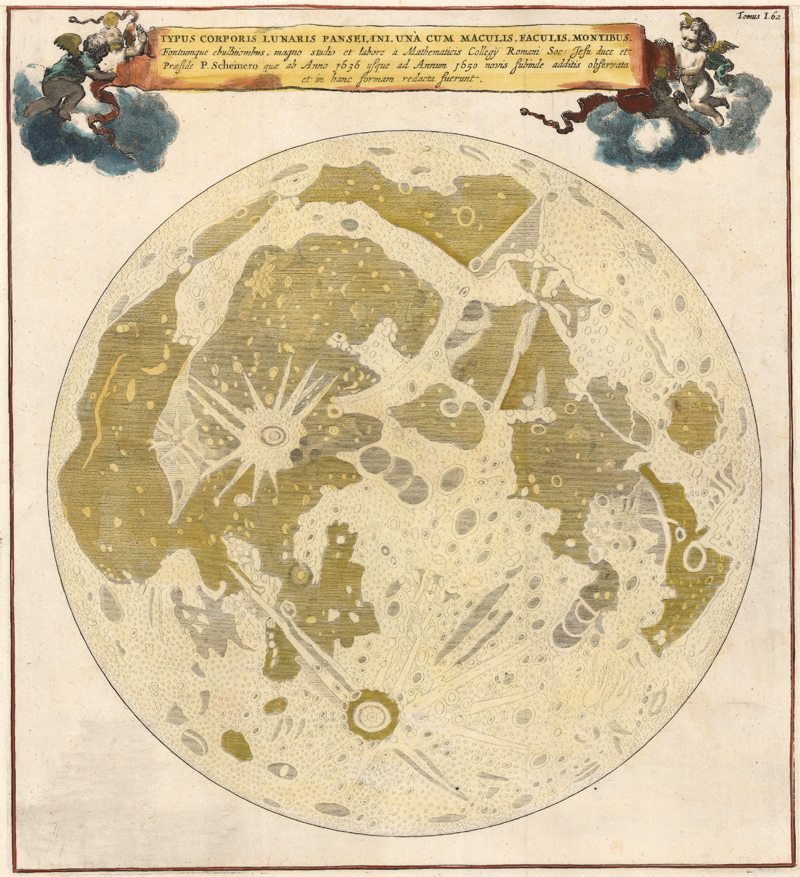
Athansius Kircher’s Typus Corporis Lunaris Panselini… (ca. 1665)
Now that we have established the roots of lunar nomenclature still in place today, let us take a closer look at other notable Moon maps from the 17th century.
One of the most popular and available 17th-century Moon maps on today’s market is Athanasius Kircher’s Typus Corporis Lunaris Panselini…, first published in his Mundus Subterraneous in 1665. Although the banner above the map credits it to the observations of Christopher Scheiner, it is actually a copy Eustachio Divini’s 1649 lunar map. (Divini is properly credited in Kircher’s text.) Divini was one of the great telescope manufacturers of his era. His Moon map was intended as a testament to the power and quality of his proprietary lenses. It was derived from Hevelius’s Moon, with adjustments based on Divini’s own findings. Kircher’s addition of putti and a banner title to the Divini original was borrowed from Hevelius as well. Divini’s map did nothing to advance selenography, but its appearance in Kircher’s text, which also described the inner workings of the Earth, would have enabled readers in the late 17th century to consider the Moon in a more geological context.
In 1665, the English microscopist Robert Hooke published a close-up image of the crater Hipparchus in his Micrographia, a work otherwise concerned with microscopic images. This was the first printed chorographic view related to the Moon, meaning that it was the first engraving to zero in on a specific lunar feature. Hooke thought the depictions of Hipparchus by Hevelius and Riccioli were inaccurate and unrealistic, failing to represent the contour and shape of the crater, which he characterized as a “vale.” His close-up view of Hipparchus showed that a new level of detail in Moon maps was possible.
Hooke’s chorographic view may have been the inspiration for similar regional renderings made at the Paris Observatory by Giovanni Domenico Cassini. Working with the draughtsmen Jean Patigny and Sébastien LeClerc, Cassini combined these drawings into the largest printed Moon map to date, first published in 1679 in a very limited broadsheet edition. Measuring 21” in diameter, the map was double the size of Hevelius and Riccioli’s maps, with an eye-catching three-dimensional quality to its topography. The map was essentially lost until it was reissued in a reduced format in the lead-up to the lunar eclipse on July 28, 1692. Although the reduced edition was less intricate than the 1679 map, it was widely copied in France well into the late 18th and early 19th centuries, supplanting Hevelius and Riccioli in encyclopedias and astronomy books.
Advances in the 18th and 19th Centuries
Tobias Mayer’s Moon (1775) (image courtesy of Wikimedia)
Just as with terrestrial maps, Moon maps took a turn towards scientific cartography in the 18th century. It is fitting that the figure behind that turn cut his teeth making maps for the Homann firm. By the time he began his lunar observations in 1748, the German astronomer Tobias Mayer had already spent two years making exacting regional maps for the Homann Heirs; he would continue his terrestrial mapmaking in parallel with his Moon pursuits. Mayer used a micrometer in his telescope to pinpoint the positions of 23 features on the Moon. He then plotted these features on a map using trigonometrical formulae. Completed in 1750, Mayer’s Moon was the most accurate lunar map up to that point. Nothing else could compare to its scientific measuring and positioning of lunar features. It was posthumously published in 1775 by Georg Lichtenberg, who added latitude and longitude and an accompanying list of 66 lunar features, with both the Hevelius and Riccioli nomenclature. Although the map was published in a small format (and with the north oriented to the top, an unconventional move at the time), its formidable accuracy raised the bar in selenography.
Mayer’s map served as the central reference map for the Moon project of the aforementioned Johann Hieronymus Schröter. Beginning in 1787, Schröter, a devoted amateur astronomer based in Lilienthal, Germany, spent more than a decade studying lunar topography under different angles of illumination, calculating the altitudes of mountains and craters, and searching for changes to the Moon’s surface. He originally hoped to improve on Mayer’s Moon with his own large-scale lunar map, but he abandoned that goal in favor of a more specialized approach. As the title suggests, the engraved plates of his Selenotopographische Fragmente (1791/1802) present the Moon in pieces, zooming in on specific lunar features like craters and rilles (terms Schröter introduced to selenography). Schröter’s magnified images underlined just how powerful telescopes had become. He also added a new enlarged etching of Mayer’s Moon map, this time with the south oriented to the top of the sheet.
Working around the same time as Schröter, the English portraitist John Russell (not to be mistaken with the map engraver of the same name) produced some of the most impressive selenographic works of the 18th century. For more than four decades, Russell sketched the moonscape in pencil and carefully measured the locations of several features, driven to capture its surface more accurately and artistically than his predecessors. (He was inspired in part by seeing the Moon maps of Cassini and Homann/Doppelmayr.) From his observations and sketches, he etched a massive pastel Moon (1795), measuring more than 5 feet in diameter, and designed his own lunar globe (1796), both of which are now part of the collection at Oxford’s History of Science Museum. His globe or “selenographia,” constructed of copper-engraved gores attached to a papier-mâché sphere, is an ingenious contraption, with an adjustable brass stand and meridian that mimics lunar libration and incorporates a miniature terrestrial globe to illustrate the Moon’s parallax. It was commercially produced, but few examples survive today. Russell’s blend of refined artistic sensibility and obsessive observation were at the cutting edge of selenography. But his work, barely distributed to begin with, lacked a coordinate grid and nomenclature, making it difficult to replicate and build on.
At the start of the 19th century, Tobias Mayer’s map remained the gold standard in lunar cartography. It took another trained cartographer to push selenography forward. In 1822, Wilhelm Lohrmann, a Dresden-based surveyor and mapmaker, hatched a scheme for a large-scale Moon map divided into 25 square sections. Two years later, he published the first four sections in Topographie der Sichtbaren Mondoberflaeche. Drawings for the remaining 21 sections were completed by the time of Lohrmann’s death in 1840, but like so many notable selenographers, his completed work was only posthumously published, in this case by Johann Friedrich Julius Schmidt. Schmidt spent decades preparing Lohrmann’s work for publication, enlisting eight engravers and an additional advisor for the task. Lohrmann’s innovation was transferring the conventions of terrestrial cartography over to the Moon. As Manasek puts it, “Lohrmann made no attempt to ‘draw’ features on his map, rather the emphasis was on using a standard cartographic language to express lunar morphology, topography, and albedo.” It is a shame that by the time the 25-part map was finally published in 1875, selenography had already advanced beyond Lohrmann’s contributions.
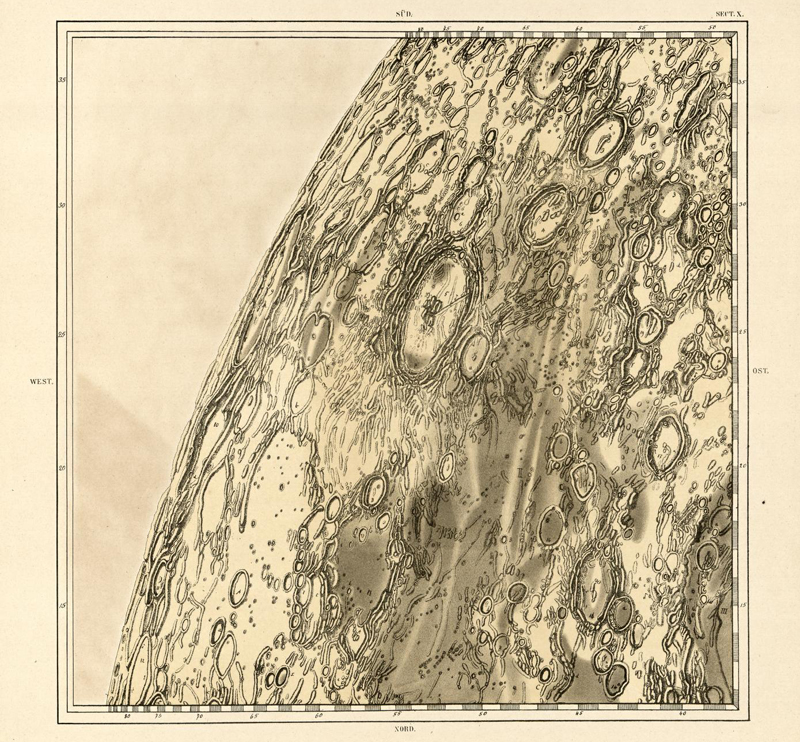
Section X of Johann Friedrich Julius Schmidt’s Charte der Gebirge des Mondes (1878) (Image courtesy of the Library of Congress)
Schmidt himself improved on Lohrmann’s map with his own 25-sheeter, Charte der Gebirge des Mondes (1878), considered the peak of lunar cartography before photographic observation became the norm. To give an idea at the exponential leap in detail between the Lohrmann and Schmidt maps, Schmidt added 26,000 newly discovered craters to Lohrmann’s baseline of 7,000.
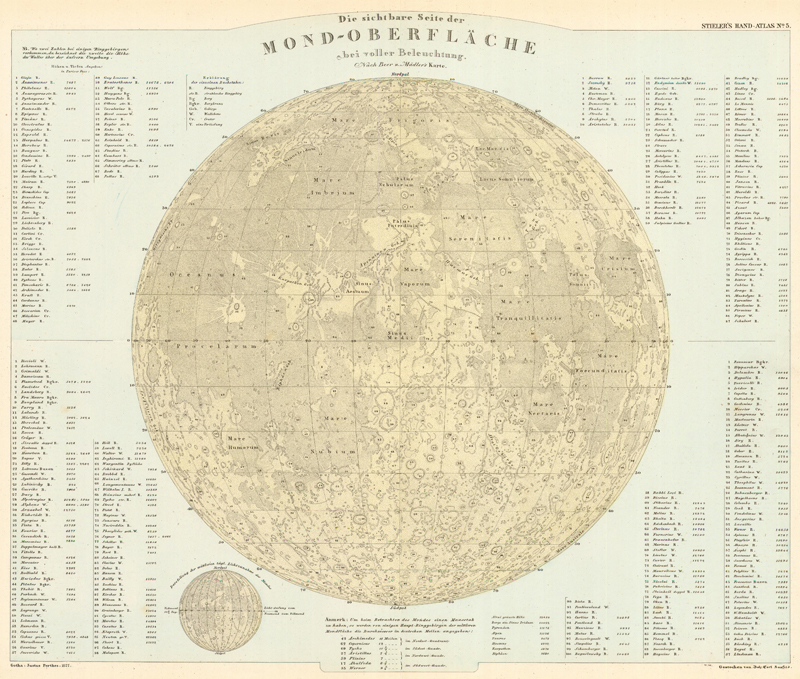
The reduced copy of the Beer and Mädler Moon in Stieler's Hand-Atlas (1877)
In between Lohrmann and Schmidt’s Moons came Beer and Mädler’s groundbreaking lunar map and book. Johann Heinrich Mädler served as the paid assistant to Berlin banker and amateur astronomer Wilhelm Beer. In 1828, Mädler, working from Beer’s private observatory, commenced on his own large-scale Moon map, using the same scale as Lohrmann but in quadrants instead of 25 parts. Since Lohrmann had only published the first four sections of his Moon, Beer and Mädler’s finished map, Mappa Selenographica (1834), became the first large-scale Moon map based on micrometric measurement. Three years later an accompanying text, Der Mond, was published. Inspired somewhat by Schröter’s Moon gazetteer, Der Mond was about as authoritative a text as was imaginable on the topic of the Moon, full of information about the various features and their positions and measurements, the history of lunar observations, nomenclature, eclipses, tides, libration, and much, much more. The Selenographia of the 19th century had arrived. According to Whitaker, “The first reaction to Beer and Madler’s monumental work was one of resignation—everything that could be learned about the Moon was there for anyone to read, and everything that could be observed with a telescope of moderate size was already mapped.” (Schmidt’s 1875 map, with its wealth of new detail, would prove the latter assumption totally false.)
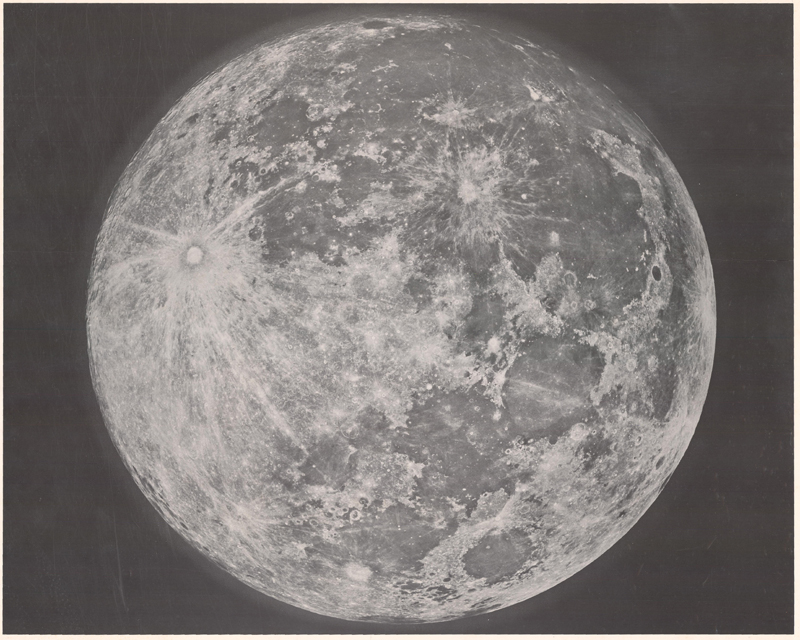
A stunning photographic image of the Moon from Gerard P. Kuiper’s Photographic Lunar Atlas (1960)
The breakthroughs of Lohrmann, Beer and Mädler, and Schmidt took telescopic observations of the Moon to their very limit. Future advancements in our understanding of the Moon would come from lunar photography. On January 2, 1839, Louis Daguerre, inventor of the daguerreotype process of photography, took the first ever photograph of the Moon. (Unfortunately, the image was destroyed in a fire.) The first photographs of the Moon were rough, blurry, and tricky to print. It took decades for the first printed photograph of the Moon to be published, by Warren de la Rue in 1865, and another three decades for the first attempts at photographic lunar atlases. Even at the close of the 19th century, photography of the Moon could not match the stunning details of the large-scale Beer and Mädler map. But in the 20th century, further advances in photography at the great observatories would open up new dimensions of detail, paving the way for the Apollo missions and the first human contact with the Moon.
References:
Ashworth, Jr., William B., The Face of the Moon: Galileo to Apollo, Linda Hall Library, 1989. https://www.lindahall.org/experience/digital-exhibitions/the-face-of-the-moon/#main-content
Kanas, Nick, Star Maps History, Artistry, and Cartography (Second Edition), Springer-Praxis, 2012.
Manasek, Francis J., A Treatise on Moon Maps: Visual Studies on Paper, 1610-1910, Bragg Hill Press, 2023.
Manasek, Francis J., “The Birth of Moon Maps: Looking Through the Telescope, 1610-1696,” Chicago Map Society, 2022. https://www.youtube.com/watch?v=N9nIZafV4_M
Sumira, Sylvia, The Art and History of Globes, The British Library, 2014.
Whitaker, Ewen A., Mapping and Naming the Moon: A History of Lunar Cartography and Nomenclature, Cambridge University Press, 2003.