2018 Year in Review: Auction Trendsby Eliane & Jon Dotson
In December, once the dust has settled from our last auction of the year, we like to take a look back and review how the year has progressed. We choose to share this with our customers for two key reasons. First we believe that being transparent with our customers fosters trust, which is essential for any business relationship. Second, we know that providing this information can help guide our bidders in their purchasing decisions and also help our consignors determine what material to send us for future auctions. At the end of the day, we believe that being open with this information is a win-win situation for everyone.
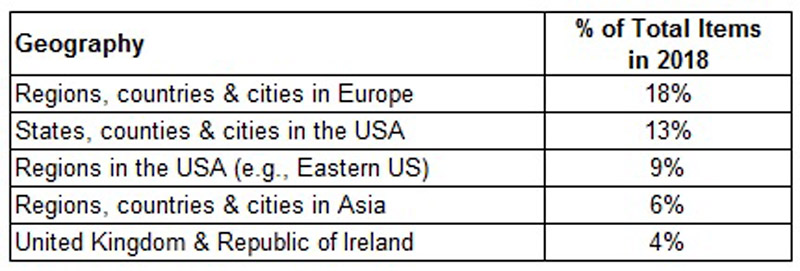
One of the key metrics we always review is our sell-through rate, which is defined as the number of items that sell as a percentage of the total number of items in the auction. Old World Auctions' overall sell-through rate for 2018 was 75%, an improvement of 3% over 2017. In fact in our May and September auctions, we sold 80% of the lots. Sell-through is always a function of both supply and demand. On the supply side, there are five geographic categories that represent 50% of the material in our auctions:
Comparing 2018 to 2017, we saw an increase in the number of maps consigned to OWA of Europe, and a decrease in maps of USA states, counties and regions. The decline in USA maps was largely driven by the special auction we hosted in 2017 of the David Morgan collection, which was focused on US material. Unfortunately, the increase in European material created an oversupply, which resulted in it being one of the worst performing categories for OWA in 2018, with a 59% sell-through (see below).
Trends by Geography
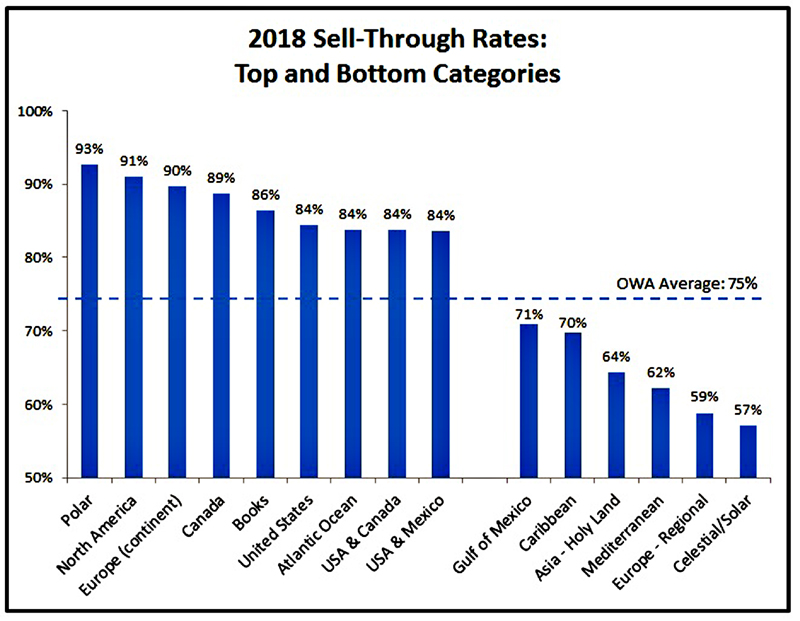
Although the average sell-through rate of 75% clearly indicates that there is still strong demand for maps, some geographies performed better than others and there were key changes from previous years. (For comparison, you can view our 2017 year in review here, and our 2016 year in review here.) The categories that maintained their positions from 2017 to 2018 were the United States near the top, and the Gulf of Mexico, the Caribbean, and the Mediterranean at the bottom. Interestingly, even though regional and country maps of Europe were one of the worst sellers in 2018, maps of the continent of Europe performed strongly. The continent of Europe, along with maps of the Atlantic Ocean and USA & Mexico, were three categories that have risen considerably in popularity over the last five years. In contrast, Celestial/Solar maps have declined since 2015, when they were a top category. Maps of the Caribbean, although still a lower-performing category, have rebounded since an all-time low of 58% sell-through in 2016.
Note: The United States category represents maps that depict the entire United States, and does not include regional or state maps. The Books category consists of history, geography, and exploration books.
Of course hammer prices are also an indicator of demand and don't always align with sell-through rates. Several of the top selling categories, including the continent of Europe, Canada, USA/Mexico, and Atlantic Ocean, sold for lower prices than in previous years. However maps of the United States, North America, and USA/Canada still maintained strong hammer prices. Although maps of the Gulf of Mexico and Holy Land did not sell as consistently in 2018, prices were high for items that did sell.
Maps over the Centuries
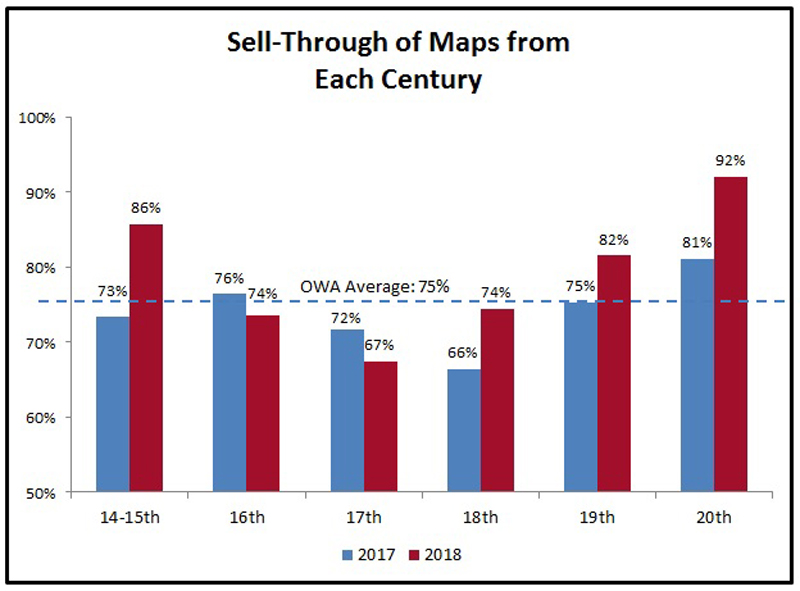
Another interesting trend relates to the performance of maps from various centuries. OWA experienced an increase in consignments of 20th century material, primarily in the form of pictorial maps. When comparing maps from each century, 20th century maps had the highest sell-through rates and strongest realized prices. Pictorial maps are clearly trending with several featured in our top ten list below, and we expect it to continue in 2019. Eighteenth century maps, which performed poorly in 2017, exhibited strong increases in both sell-through and realized prices in 2018. All other centuries had minor increases in realized prices in 2018, with some improving and others declining in sell-through compared with 2017.
Top Selling Items
We also reviewed our top individual performing lots, and what stood out most is that half are late 19th/early 20th century maps. Geographically, the top 10 items break out as follows: Americas (5), World (2), Prints (2), and Holy Land (1).
Auction 169 - Lot 44. Carriers of the New Black Plague, by William Cotton, 1938. Sold for $1000 -- 625% above the high estimate
Auction 168 - Lot 610. Palestine Land of Strife, by New York Daily News, 1945. Sold for $350 -- 438% above the high estimate
Auction 166 - Lot 233. North Pacific Ocean - The Hawaiian Islands [with report] Hawaii, by U.S. Government, 1897. Sold for $500 -- 333% above the high estimate
Auction 168 - Lot 292. Texas, by Carl Flemming, 1850. Sold for $1200 -- 320% above the high estimate
Auction 170 - Lot 238. Map of the City of Los Angeles, by James Chadwick, 1915. Sold for $600 -- 316% above the high estimate
Auction 169 - Lot 768. Verklaaring van 't Klyne Tafereelije…, by Anonymous, 1720. Sold for $275 -- 289% above the high estimate
Auction 169 - Lot 332. Nombre de Dios, Gelegen Tusschen Zuid en Noord Amerika, aen de Noordzee, by Pierre Schenk, 1700. Sold for $1000 -- 286% above the high estimate
Auction 168 - Lot 58. Yaggy's Geographical Portfolio, by Levi Yaggy, 1893. Sold for $8500 -- 283% above the high estimate
Auction 167 - Lot 426. Das Thier Rhinoceros Genannt, by Sebastian Munster, 1588. Sold for $500 -- 238% above the high estimate
Auction 166 - Lot 149. Map of a Reconnaissance Between Baltimore and Philadelphia Exhibiting the Several Routes of the Mail Road...Approved on the 4th of May 1826, by U.S. Government, 1828. Sold for $400 -- 235% above the high estimate
Early Results on the New Website
As most of you are aware, we launched our new website in March 2018 and have since conducted four auctions on the new platform. Over the summer we introduced high-resolution imagery to the entire archive (over 80,000 images and counting), and launched the first iteration of our mobile-friendly site for the November auction. While we encountered some minor kinks/growing pains with the transition, the feedback that we've received has been overwhelmingly positive. We appreciate everyone's time getting used to the new site and hope you are enjoying the improved experience.
In the continued spirit of transparency, we thought it would be fun to share some data related to the new site. Over the last quarter, our total number of users increased by 16% over the same period last year (on the former website). The average amount of time a given user spent on the website increased by 5% over prior year, and the number of times a given user visited us also increased by 5%. While these are early indicators, the data reveals that more people are visiting us and spending more time on the site.
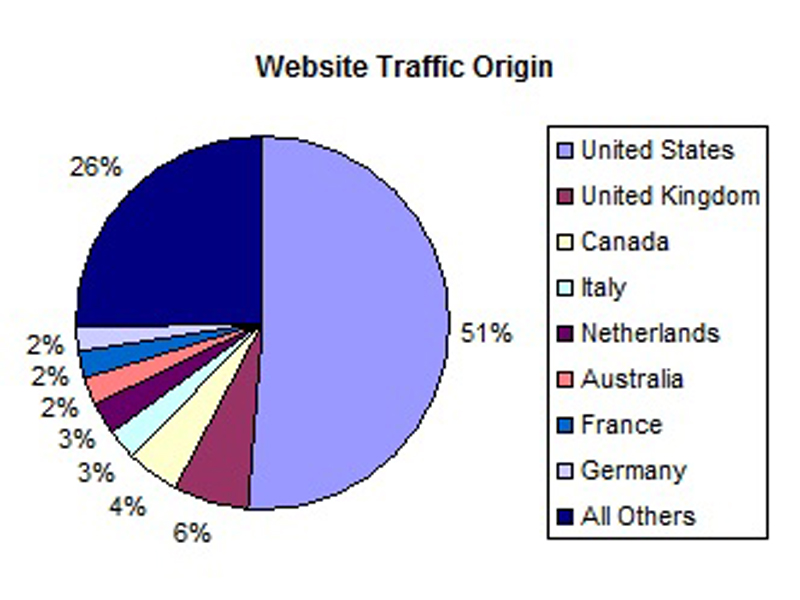
Looking at the origins of our site traffic, over half of our visitors are from the United States. Internationally we are seeing increased traffic with Australia, the United Kingdom, Netherlands, and Germany all growing by over 20% versus last year (a portion of this growth is likely due to favorable exchange rates to the dollar). The top eight countries in terms of total number of users were:
Another interesting observation is the large increase in the use of mobile phones with the new website. Mobile phones had a 31% usage increase over prior year, while desktop (+14%) and tablet growth (+3%) slightly trailed the site average growth (+16%). As we continue to improve and invest in our mobile experience over the coming months, we anticipate more users will visit us via smaller devices. Please note that we still strongly encourage bidders to use desktops/laptops at auction close as this is the best way to utilize the bid status page! Stay tuned for more website updates in the coming months, and we hope you will let us know of any issues you experience with our website so that we may address them.