2019 Year in Review: Auction Trendsby Eliane & Jon Dotson
In December, once the dust has settled from our last auction of the year, we like to take a look back and review how the year has progressed. We choose to share this with our customers for two key reasons. First we believe that being transparent with our customers fosters trust, which is essential for any business relationship. Second, we know that providing this information can help guide our bidders in their purchasing decisions and also help our consignors determine what material to send us for future auctions. At the end of the day, we believe that being open with this information is a win-win situation for everyone. (And plus we love crunching numbers, which was ingrained in us during our business school days!)
There are two key metrics that we consider to determine whether an auction was successful: how much of the material we sold and what prices we achieved. The first of these is known as "sell-through" and is calculated as a percentage of the total material offered. The overall sell-through rate remained steady at 75% from 2018 to 2019, which compares favorably with the average sell-through of 72% reported by Rare Book Hub for all auction houses selling collectibles in 2019. In fact, our most recent auction achieved a sell-through of 83%, which is the highest we've had in nearly 5 years.
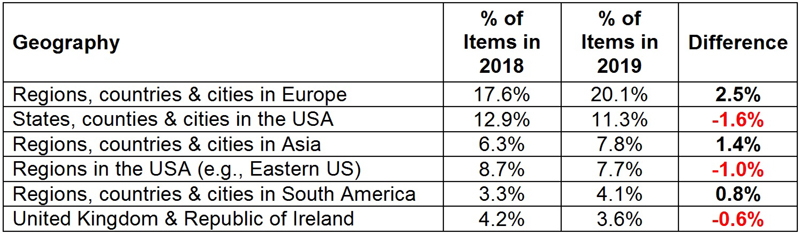
We consider sell-through as an indication of whether we're offering the right type of material to our customers. Although our sell-though was constant in 2018 and 2019, our mix of material changed a bit, in some cases for the better and in some cases for the worse.
The increase in regional maps of Europe, Asia and South America caused an oversupply issue, resulting in lower sell-through and lower prices in these categories. Essentially the opposite occurred with regional and state maps of the USA, in which a decline in material led to higher than average sell-through. As our auctions operate on a consignment basis, this means that in 2020 we need to seek out more consignments of US-based material and likely turn away some European, Asian, and South American material.
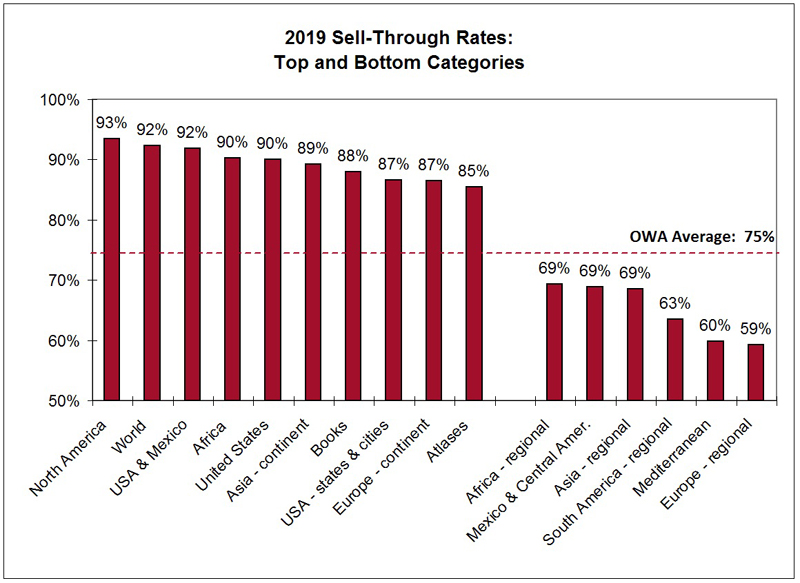
Trends by Geography When we considered the sell-through of each major geographical region, there were some regions that remained consistent with previous years and some surprises. Similar to last year, maps of North America, the continent of Europe, the United States, United States & Mexico, and books (regarding history, geography and exploration) were at the top of the list. Categories that significantly improved from 2018 to 2019 to make it to the top of the list are maps of the World, Africa, Asia, maps of US States and cities, and atlases. On the other end of the spectrum, maps of the Mediterranean and European countries/cities continue to be at the bottom of the list. Regional maps of Africa, Asia and South America joined the hard hit categories, in addition to maps of Mexico and Central America. Several geographies showed improved prices in 2019 vs. 2018, sometimes corresponding with strong sell-through and sometimes contradicting it. Those with higher prices include the continent of Europe, the Caribbean, and the Mediterranean, while other categories, such as Holy Land, Central America & Mexico, and regional maps of South America declined in price.
Note: The Books category consists of history, geography, and exploration books.
One other interesting point is that not all regional maps of Europe performed the same. Eastern Europe (with the exception of Russia) was a very strong category in 2019, with 78% sell-through and high prices. Northern & Central Europe were slightly above average with maps of these broader regions performing better than maps of individual countries or cities. The worst performing region within Europe was Western Europe - in particular Belgium and the Netherlands.
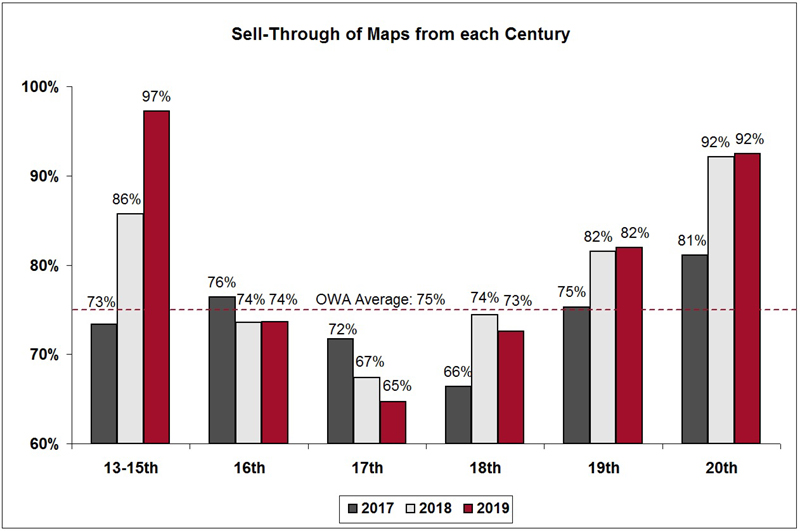
Maps over the Centuries Another change in the mix of our material was that we included more 20th century maps in 2019 due to the current popularity of this time period. Twentieth century material, which includes antique/vintage maps (75%) and reference books (25%), increased from 7% of the catalog in 2018 to 12% in 2019. We plan to grow this category in 2020, as we sold 92% of the items we offered in 2019 at very strong prices (as evidenced by our top 10 items below), so there is still strong demand for this material. Early material (13th-15th centuries) represents only 1% of the catalog and is comprised of medieval manuscripts from Books of Hours and Incunabula (by Hartmann Schedel). Although this early time period was the strongest performer in terms of sell-through in 2019, it was largely driven by the fact that the majority of the medieval manuscripts were listed as "no reserve" items. In contrast, 17th century material, which comprised 25% of the material this past year, declined in both sell-through and value since 2018.
Top Selling Items We also reviewed our top individual performing lots, and not surprisingly, regional maps of the Americas comprise the majority of this list, and more than half are 20th century pieces:
Auction 175 - Lot 244. 1929 Map of Houston, by Texas Blue Print & Supply Co, 1929. Sold for $2300 -- 1211% above the high estimate
Auction 171 - Lot 687. [Lot of 2] Carte des Iles Philippines [and] Baie de Manille par M. de Malespina, by D'Houdan, 1808. Sold for $1900 -- 864% above the high estimate
Auction 171 - Lot 771. [Manuscript U.S. and Civil War Atlas], by Herman Hering, 1888. Sold for $4250 -- 607% above the high estimate
Auction 175 - Lot 198. Grand Panoramic View of the Heart of Chicago…, by George Melville, 1893. Sold for $1000 -- 526% above the high estimate
Auction 174 - Lot 261. Mount Rainier National Park, by U.S. Corps of Engineers, 1908. Sold for $350 -- 500% above the high estimate
Auction 174 - Lot 715. [Map of Luzon - Showing the Routes of General Lawton's Troops During His Several Campaigns on That Island], by U.S. War Department, 1900. Sold for $950 -- 500% above the high estimate
Auction 171 - Lot 189. Gallup's Map of the Central-Southern Oil Fields of the United States, by F.E. Gallup, 1920. Sold for $1800 -- 480% above the high estimate
Auction 172 - Lot 187. The Southwestern United States, by National Geographic Magazine, 1940. Sold for $275 -- 458% above the high estimate
Auction 172 - Lot 300. Panama een Koopstadt in Zuid-Amerika Gelegen aen de Zuidzee, by Pierre Schenk, 1700. Sold for $1600 -- 457% above the high estimate
Auction 175 - Lot 181. [Lot of 3] Map of the City of Los Angeles, by Homer Hamlin, 1917. Sold for $800 -- 400% above the high estimate
Our Customers In addition to analyzing the material listed at auction, we also enjoy seeing where our bidders reside. For the year, 70% of bidders came from the United States, 4% from Canada, 3% from the United Kingdom, and Australia, Spain, Italy and the Netherlands were all at 2%. In total we had bidders from 53 different countries including Argentina, China, Finland, India, Malaysia, Philippines, Romania, and the United Arab Emirates to name a few. We truly appreciate getting the opportunity to work with people as diverse as our antique maps!